

Curved displays can meaningfully improve workflow comfort and data accessibility for professionals analyzing dense 3D point clouds and scientific visualizations, particularly when screen sizes exceed 32 inches and tasks involve frequent peripheral scanning. The consistent focal distance they provide reduces the need for constant eye re-accommodation across wide fields of view, which is a common source of fatigue in long analysis sessions. However, the choice depends heavily on your specific mix of geometric precision work versus exploratory multi-scale viewing; not every scientific workflow benefits equally.

The Ergonomic Logic of Curvature for Data Scientists
Data scientists and GIS professionals often spend hours navigating massive point-cloud datasets that span the full width of an ultrawide viewport. On flat displays, the edges sit farther from the eyes than the center, forcing repeated focus shifts that increase visual fatigue. Research from a PubMed study on curved versus flat monitors shows that curved screens (especially on 33-inch and larger panels) can improve visual search accuracy and speed while lowering reported fatigue during extended sessions.
This ergonomic advantage matters most in scenarios with high data density, where analysts constantly compare central 3D models with peripheral attribute tables or timeline views. The curvature creates a more uniform viewing distance, helping maintain context without constant head or eye movement. For most users working on 34-inch or 49-inch screens, this translates to noticeably less strain after four or five hours of continuous use.
The benefit is not universal. It scales with screen size and task type. Smaller 27-inch panels show smaller gains, and purely linear 2D alignment tasks gain little from curvature.
Optimizing Workflow for Multi-Scale Scientific Visualization
In daily point-cloud analysis, professionals juggle a primary 3D viewport alongside dense side panels showing attributes, histograms, or cross-sections. Curved ultrawide monitors bring those far-edge elements into the natural focal arc, reducing the physical and cognitive breaks that occur when panning across a flat screen.
A key HCI study on large high-resolution displays demonstrated that curvature improves performance on multi-scale geospatial tasks by making all screen regions more equally accessible. This directly supports common scientific workflows: rapidly switching between detailed point inspection in the center and broader context or metadata on the sides.
The curvature radius determines the strength of this effect. A 1500R curve strikes a practical balance for many balanced analysis tasks, while a tighter 1000R curve excels when side-panel work dominates. This creates a clear scenario split: prioritize curvature when your ratio of exploration to precise alignment exceeds roughly 60/40. Flat displays remain preferable when geometric truth and straight-line fidelity are non-negotiable.
Technical Specifications for 2026 Workflows: Beyond the Hype
Scientific visualization in 2026 demands more than high pixel counts. For stereoscopic 3D mapping and fly-throughs in tools like ArcGIS Pro, a minimum 120Hz refresh rate prevents flicker that would otherwise appear as 30Hz or 60Hz per eye. This threshold turns what many view as a gaming feature into a professional requirement for comfortable spatial navigation.
Dense point clouds exceeding 10 million points also benefit from high temporal resolution. At 144Hz or 180Hz, panning and rotation feel continuous, preserving orientation that lower rates can disrupt. Resolution choices follow a similar logic: 3440x1440 ultrawide or 5120x1440 super-ultrawide offers ample real estate for side-by-side views, while 4K (3840x2160) on 27- or 32-inch panels prioritizes pixel density for fine detail inspection.
Panel type and color performance matter too. VA panels common in curved gaming monitors deliver strong contrast for depth perception in 3D renders, though they trade some color uniformity compared with professional IPS panels. High VRAM on the GPU side (16GB+) and OpenGL compatibility remain critical for smooth interaction, aligning many current high-refresh curved monitors with these needs.
When Curved Displays May Not Be the Best Choice
Despite the ergonomic gains, curved displays introduce trade-offs that disqualify them for certain scientific tasks. The most cited concern is geometric distortion: straight lines can appear slightly curved near the edges, which complicates precision CAD work, parcel boundary maintenance, or any analysis requiring absolute linear fidelity. As one monitor comparison resource notes, this effect may require an adaptation period and can undermine confidence in measurements that depend on perfect geometry.
Users transitioning from multi-monitor flat setups often report initial discomfort adjusting to a single large curve. Color-critical applications may also favor flat IPS panels that maintain more consistent accuracy across the screen. The KTC H27P3 5K office monitor, for instance, excels in high-resolution 2D and color-accurate flat workflows where curvature adds no benefit.
In short, choose flat when your daily ratio of alignment and measurement tasks exceeds exploration. The curvature advantage disappears or even becomes a liability in those cases.

Decision Section: Technical Features to Workflow Outcomes
Translating specifications into real analysis outcomes requires matching your dominant task type to the right hardware. For information-dense exploration with heavy side-panel use, a super-ultrawide like the KTC H49S66 49-inch DQHD 180Hz curved gaming monitor brings peripheral data comfortably into view while delivering 180Hz fluidity that supports stereoscopic comfort and smooth navigation of large point clouds.
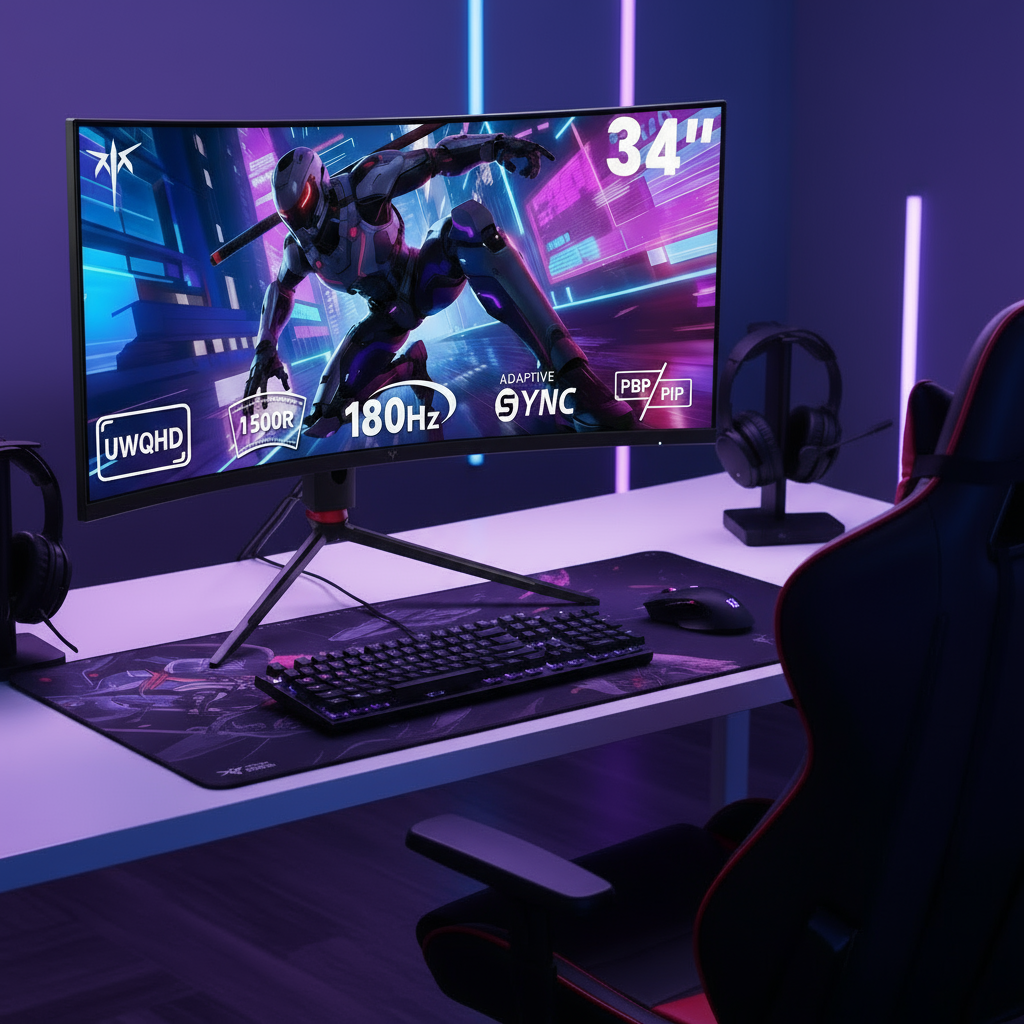
When balanced analysis is the goal and some geometric precision remains important, the KTC H34S18S 34-inch ultrawide curved gaming monitor with 1500R curvature and 180Hz refresh offers a strong middle ground. Its 21:9 aspect ratio provides ample workspace without the more pronounced distortion possible on tighter curves.
For users who occasionally need maximum color accuracy or linear fidelity, keep a secondary flat high-resolution option such as the professional-grade KTC H27P3 or pair a curved primary display with a flat secondary. The 90% rule often applies here: many scientific users achieve near-professional contrast and refresh performance with these high-spec curved models without the burn-in risks or premium pricing of dedicated enterprise visualization hardware.
Setup tips for minimal distortion include positioning yourself at the manufacturer-recommended distance (typically 0.7–1 meter for 1000R–1500R curves) and enabling any available geometry-correction tools in your visualization software. Test both curved and flat configurations with your actual datasets before committing.
How Do Curved Displays Affect Eye Strain in Long Scientific Analysis Sessions?
Studies indicate that larger curved monitors can reduce visual fatigue during prolonged visual search tasks compared with flat equivalents of the same size. The effect is most pronounced above 32 inches when users scan across wide fields. However, individual adaptation and exact viewing distance play large roles; some professionals still prefer flat panels for tasks requiring absolute focus on linear elements.
What Screen Size and Curvature Work Best for 3D Point-Cloud Work?
34-inch 1500R and 49-inch 1000R ultrawides are popular choices. The 34-inch size suits balanced workflows needing both viewport and attribute visibility, while the 49-inch model maximizes immersive exploration for very dense datasets. Choose based on whether your primary need is side-panel accessibility or geometric precision.
Is High Refresh Rate Necessary for Scientific Visualization?
For stereoscopic 3D mapping and fluid navigation of large point clouds, 120Hz or higher is often recommended to avoid perceptible flicker or stutter. In 2026 workflows using tools like ArcGIS Pro or CloudCompare, this specification improves spatial orientation and reduces discomfort during extended fly-throughs or rotations.
When Should a Data Scientist Stick With Flat Monitors Instead?
Flat monitors remain superior for precision CAD, parcel mapping, or any task where straight-line geometry must be trusted without mental correction. They also avoid adaptation friction for users coming from traditional multi-monitor desks and often provide more consistent color performance across the entire panel for critical 2D analysis.
How Should I Set Up a Curved Monitor to Minimize Distortion in Analysis Software?
Sit at the distance recommended for your curvature radius, typically around 70–100 cm for 1000R–1500R models. Enable any software-level geometry compensation if available, and calibrate your viewing angle so the screen center aligns with eye level. Test with your specific point-cloud datasets to confirm that edge distortion does not affect key measurements.
Does Curvature Improve Productivity in GIS and Remote Sensing Work?
Many GIS professionals report better context retention and fewer panning interruptions when using curved ultrawides for multi-scale visualization. The ergonomic improvement helps most when comparing central models with peripheral metadata panels, though gains diminish for purely linear 2D editing tasks.


