


Local LLM deployment creates a unique information-density problem that most standard office monitors cannot solve. Running models locally requires simultaneously viewing a code editor, real-time terminal logs, GPU metrics such as VRAM usage and power draw, and documentation or browser tabs. The constant window switching—often called Toggle Tax—breaks flow state, slows debugging, and increases the chance of missing critical spikes or errors. High pixel-density displays and thoughtful multi-monitor layouts reduce this friction by keeping essential information in view without constant Alt-Tabbing.

The Information Density Challenge of Local AI Workflows
Developers running LLMs locally must monitor four distinct information streams at once: the primary code editor, terminal output with inference logs, GPU performance metrics, and reference materials. Traditional single-monitor setups force frequent toggling between windows, which research shows increases cognitive load and reduces productivity in complex tasks. This Toggle Tax becomes especially costly during live inference testing, where missing a VRAM spike or error in the logs can require restarting long training or generation runs.
Visibility here is not a luxury but a practical diagnostic requirement. GPU metrics delivered through tools like NVIDIA’s Management Library (NVML) let developers track real-time VRAM allocation, temperature, and utilization. Similarly, local LLM frameworks such as Ollama surface detailed server logs that reveal token generation rates, model loading status, and inference errors. Without enough screen real estate, these streams compete for space, raising mental effort and slowing iteration.
For many AI developers, the first practical upgrade is moving beyond a single 1080p or 1440p display. A larger canvas—whether through higher resolution, multiple monitors, or an ultrawide—directly addresses the core pain of insufficient visible workspace during local model testing.
Beyond Resolution: Why Pixel Density (PPI) Dictates Long-Term LLM Productivity
Resolution alone is only the starting point; pixel density (PPI) ultimately determines how comfortably you can read dense technical text for hours. A 32-inch 4K panel delivers roughly 137 PPI, while a 27-inch 5K screen reaches about 218 PPI. The difference becomes obvious when viewing small-font terminal logs or syntax-highlighted code at 100% scaling. Lower PPI forces either tiny text that strains the eyes or larger scaling that reduces usable workspace.

Clinical studies have shown that higher display resolution and pixel density improve the eye’s accommodative response, potentially reducing digital eye strain during long technical reading sessions. For sessions longer than four hours, staying above roughly 160 PPI at 100% scaling is a practical rule of thumb to limit fatigue. This is especially relevant for AI work, where logs and error traces often use 8–10 pt fonts.
Subpixel layout also matters. Most code editors handle RGB subpixel arrangements better than BGR, producing sharper font smoothing and less color fringing on syntax highlighting. Avoid panels known for washed-out contrast in dark themes common in development environments.
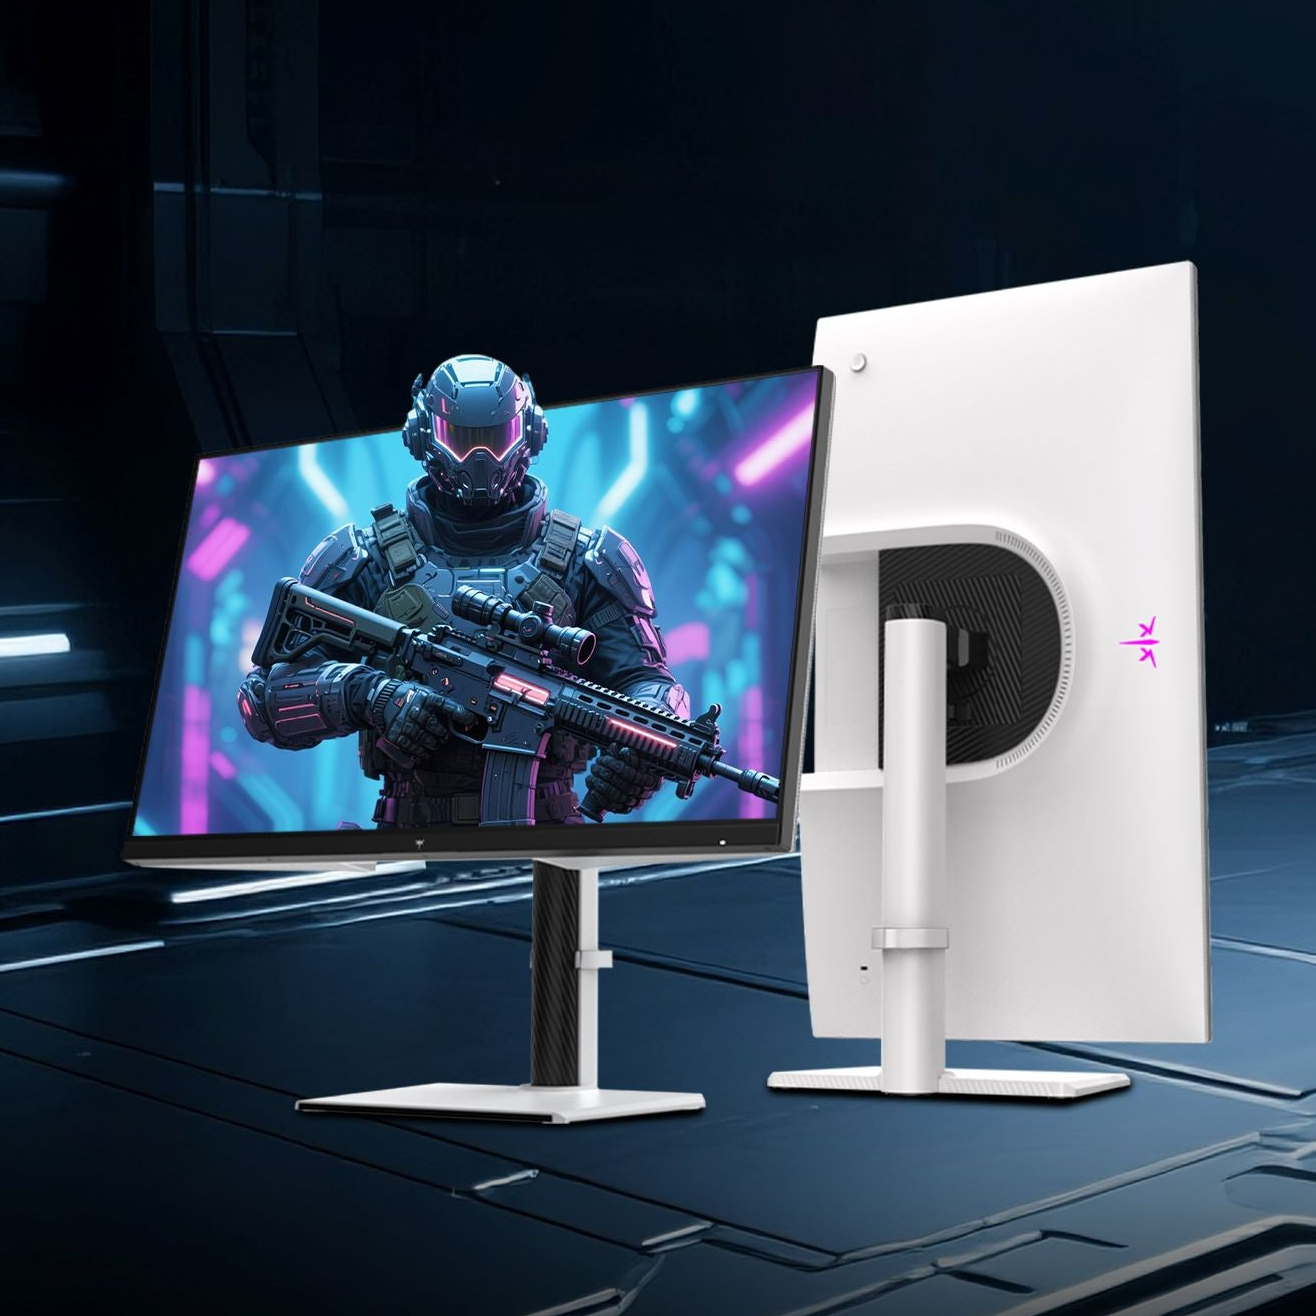
The KTC H27P3 27-inch 5K monitor is a strong match for this need. Its 218 PPI and accurate color (ΔE<2) deliver crisp text without forcing aggressive scaling, making dense AI logs and documentation far more readable over extended sessions. Pairing it with proper ergonomic positioning further supports long-term productivity.
For more on related display characteristics, see our guides on Why Some Monitors Make Syntax Highlighting Look Washed Out or Hard to Tell Apart, What Subpixel Layout Is and Why RGB and RGBW Panels Look Different, and the Home Office Setup Guide: How to Choose the Right Ergonomic Monitor.
Mapping the LLM Workspace: Strategic Window Placement for Monitoring and Code
Effective layouts treat the screen as a spatial attention map rather than a flat canvas. Reserve the central foveal zone—the area of sharpest vision—for your primary code editor (VS Code, Cursor, or similar) to maintain deep focus. Place high-velocity information such as Ollama or vLLM logs in a vertical orientation on the right or a dedicated side monitor; vertical alignment shows more trace history without horizontal scrolling.
GPU metrics from NVML or observability dashboards belong in a quick-glance quadrant, typically top-right. This placement mirrors cockpit-style status indicators, allowing peripheral checks without breaking coding flow. Professional GPU monitoring tools like the NVIDIA Management Library (NVML) allow developers to track critical metrics such as VRAM allocation, power draw, and core utilization in real time. Official troubleshooting guides for local LLM tools emphasize the importance of monitoring server logs to track token generation and debug inference errors.
Advanced observability dashboards, such as those used in vLLM, utilize metrics exporters to visualize GPU bottlenecks and inference throughput on a dedicated monitoring canvas.
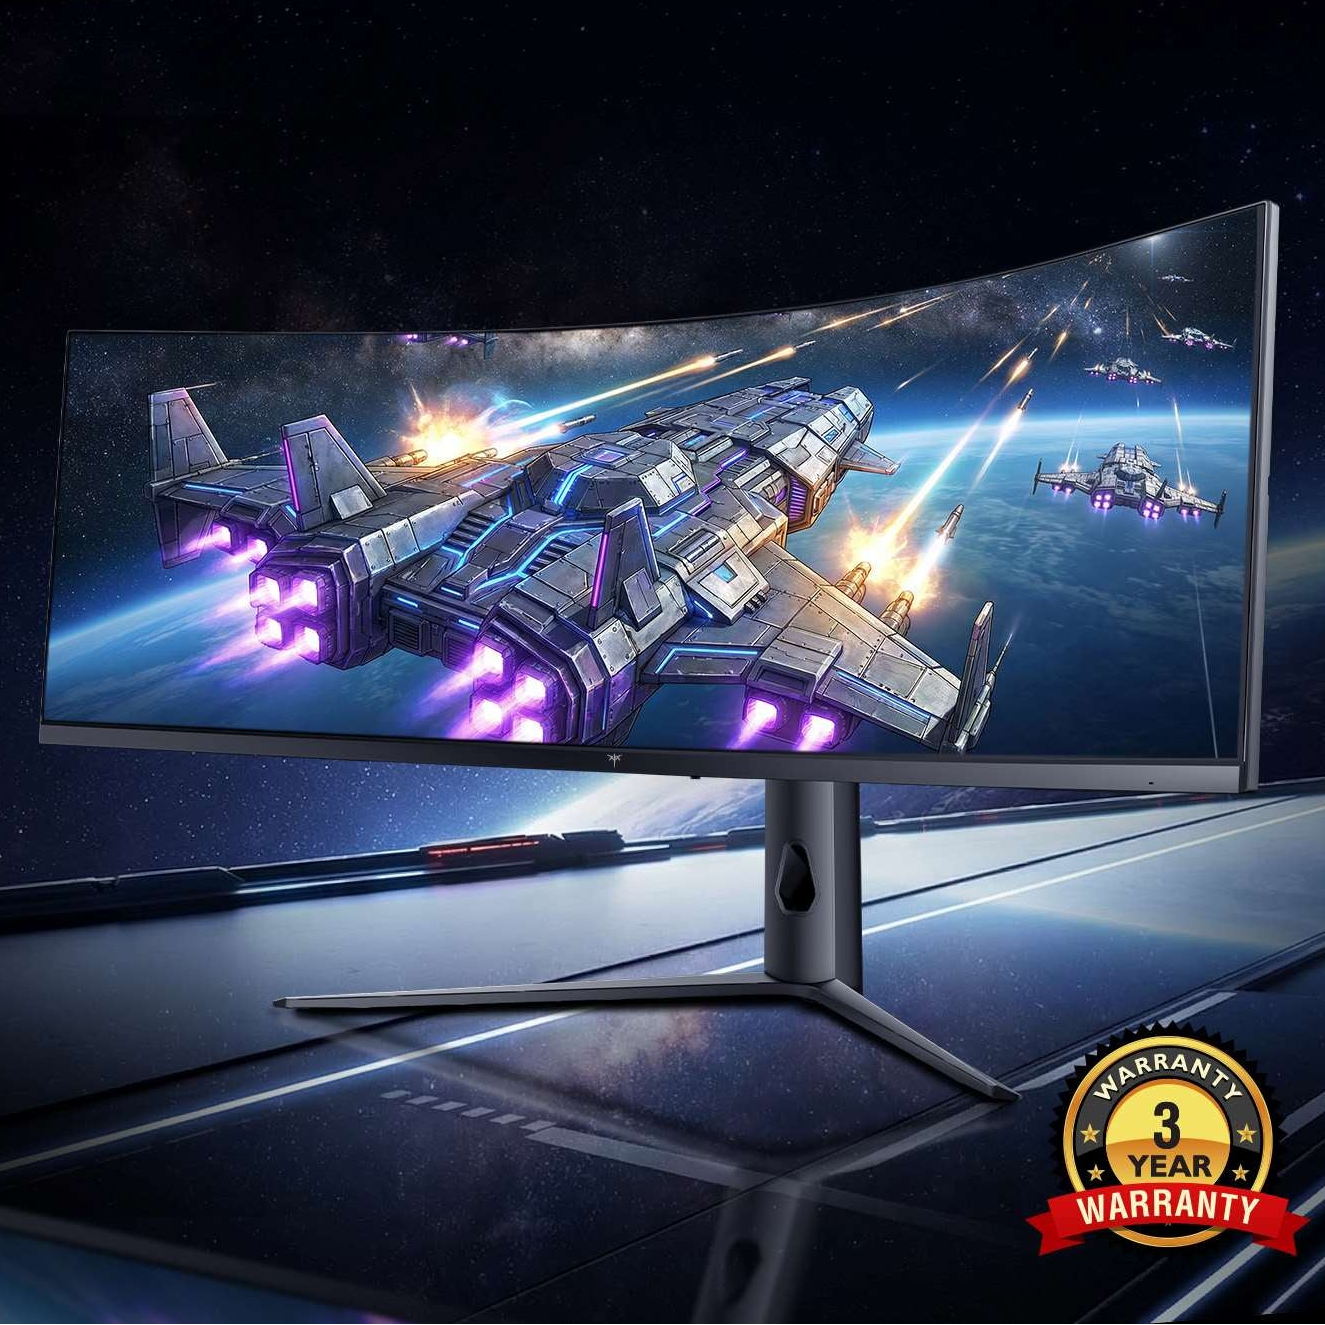
A vertical monitor excels for logs. The KTC H25Y7 can be rotated to portrait mode, giving tall, narrow real estate ideal for streaming terminal output. For developers who prefer a single large canvas, the KTC H49S66 49-inch super-ultrawide provides a seamless panoramic workspace that eliminates bezels between windows.
Many developers find that a hybrid approach works best: a high-PPI primary display for code paired with a secondary vertical or ultrawide for monitoring. Our guide to Vertical vs. Horizontal: How to Build the Ultimate Dual Monitor Productivity Setup explores these configurations in detail.
Multi-Monitor vs. Ultrawide: Choosing the Right Layout for Local Model Testing
The choice between multi-monitor and ultrawide setups depends on whether your workflow benefits more from physical separation or seamless horizontal space. Academic research indicates that multi-monitor workstations significantly increase productivity for complex tasks by reducing the cognitive load associated with window switching.
Dual or triple-monitor configurations offer clear modularity. You can dedicate one screen exclusively to production code, another to monitoring dashboards, and a third (often vertical) to logs. This physical separation helps maintain context when comparing model outputs or debugging across environments. It also allows independent brightness, color, and orientation adjustments per task.
A single large ultrawide or super-ultrawide, such as the 49-inch KTC H49S66, removes bezels and creates one continuous canvas. This is advantageous for side-by-side model comparisons, long timeline views, or dragging windows freely without edge interruptions. The curve helps keep edge content within comfortable viewing angles, though neck strain can occur if the monitor is not positioned correctly.
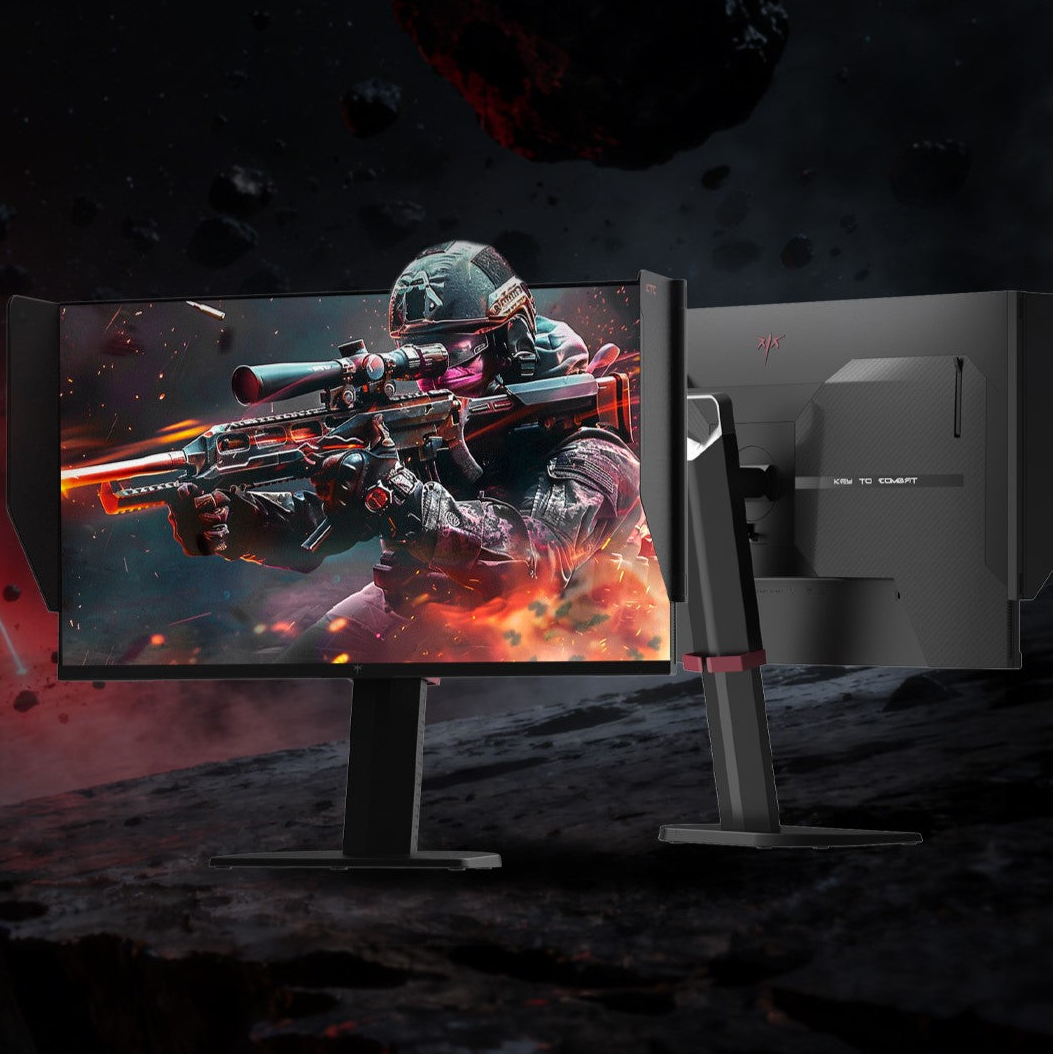
For developers who also game, the KTC H27P6 dual-mode 4K/1080p monitor provides flexibility: sharp 4K for detailed LLM work and high-refresh 1080p for competitive play on the same panel. The decision often comes down to desk space and personal tolerance for bezels versus the learning curve of managing multiple independent displays.
The Ultimate Setup: Balancing 4K Clarity with Multi-Window Control
A balanced local-LLM workstation typically starts with a high-PPI primary display for code and documentation, supplemented by dedicated space for metrics and logs. The “Pro” configuration pairs a 27-inch 5K or high-quality 4K Mini-LED primary with a vertical secondary. The KTC H27P3 or the Mini-LED KTC M27P6 both deliver excellent text clarity and color accuracy for long sessions. Add a compact vertical monitor or the KTC H15F9 portable as a sidecar for GPU dashboards.
For a more budget-conscious single-canvas option, the 32-inch 4K KTC H32P22P offers generous workspace at a lower price point, though its lower PPI at typical viewing distances may require scaling adjustments. Travelers can use portable monitors like the H15F9 to maintain a minimal monitoring setup on the go.
USB-C connectivity simplifies these multi-display arrangements by carrying video, power, and data over one cable. Our guide How a USB-C Monitor Can Streamline Your Workspace explains the practical benefits.
The final decision factor is your primary bottleneck. If desk space is tight or you dislike managing multiple inputs, a single high-quality ultrawide or 5K panel often suffices. If cognitive load from constant switching is the bigger issue, adding a dedicated vertical or side monitor for logs and metrics yields the largest productivity return. Test your current Toggle Tax for a week; the frequency of window changes usually reveals which layout upgrade will deliver the most noticeable improvement.
How Many Monitors Do Developers Typically Use for Local LLM Work?
Most power users settle on two or three displays. A primary high-PPI screen for the code editor, a vertical secondary for logs, and sometimes a small third for always-visible GPU metrics. Single-monitor users frequently report higher frustration during active inference and debugging phases. The exact number depends on desk real estate and whether you prefer ultrawide continuity over modular separation.
Does 4K or 5K Provide Better Text Clarity for Terminal Logs and Code?
5K on a 27-inch panel (218 PPI) generally provides superior clarity at 100% scaling compared with 4K on a 32-inch panel (137 PPI). The higher density reduces the need for scaling, preserves more workspace, and minimizes eye strain during extended reading of small-font logs. 4K remains excellent on 27-inch screens; the 32-inch size is where PPI trade-offs become noticeable for dense technical interfaces.
Should I Choose an Ultrawide or Traditional Dual Monitors for AI Development?
Choose ultrawide if you value seamless window dragging, long horizontal log views, and minimal bezels for model comparison. Opt for dual monitors when you want physical task separation, independent orientation (especially vertical for logs), and easier color or brightness tuning per window. Many developers start with dual 27-inch 4K panels and later add an ultrawide as a central canvas.
How Does Pixel Density Affect Eye Strain in Long LLM Development Sessions?
Higher PPI improves the eye’s ability to focus on fine text, reducing accommodative effort and associated fatigue. Below roughly 160 PPI at 100% scaling, many developers notice increased dryness, headaches, or the need to lean closer. Combining high PPI with proper ergonomics, blue-light management, and 20-20-20 breaks further protects comfort during multi-hour local model testing.
What Is the Best Monitor Layout for Monitoring GPU Usage While Coding?
Place the code editor in the center, terminal logs on a vertical right-hand screen or tall window, and GPU metrics (VRAM, temperature, utilization) in the top-right peripheral zone for quick glances. This arrangement leverages natural eye movement patterns and keeps high-priority diagnostic data visible without disrupting coding flow. Tools like NVML or vLLM dashboards work best when they occupy a consistent, non-overlapping region.


